
If you’ve tried deploying your trained deep learning models on Android, you must have heard about TensorFlow Lite, the lite version of TensorFlow built for mobile deployment.
As a quick overview, it supports most of the basic operators; in simple terms, you can use it to do classification, object detection, semantic segmentation, and most of the text synthesis operations.
And with the recent TFLite 1.0 release, the TensorFlow team added a number of features that make deployment a lot easier. One such underrated use case is benchmarking and profiling.

Now, the library provides detailed profiling with layer-level metrics.
To get started, first clone the TensorFlow repo and switch to the latest code (in my case r2.0)
Then, you can see the configure file there.
Keep all the settings as default (or as per your use case), but when you’re asked to set up WorkSpace for an Android build, say yes and give the relevant paths to the SDK and NDK.
Next, we need to build the executable required for benchmarking:
If you don’t have bazel installed, you can install bazel through Homebrew for mac or through conda, if you have Anaconda/Miniconda. The best way to install is to through their website.
At this point in time, you have to keep your phone connected through USB and keep the USB debugging on. Then, use the following command to copy the benchmark executable into the phone’s temp folder:
You have to make the command executable, so you’ll do that through the following command:
Now you have to copy your TFLite model to the phone to run the debug. Let’s assume your model name is “deeplab_257.tflite” and that it is in the current working directory. This command copies the model to phone:
Now, to run the benchmark, all we have to do is run the executable on the TFLite graph file you’ve just copied to the phone:
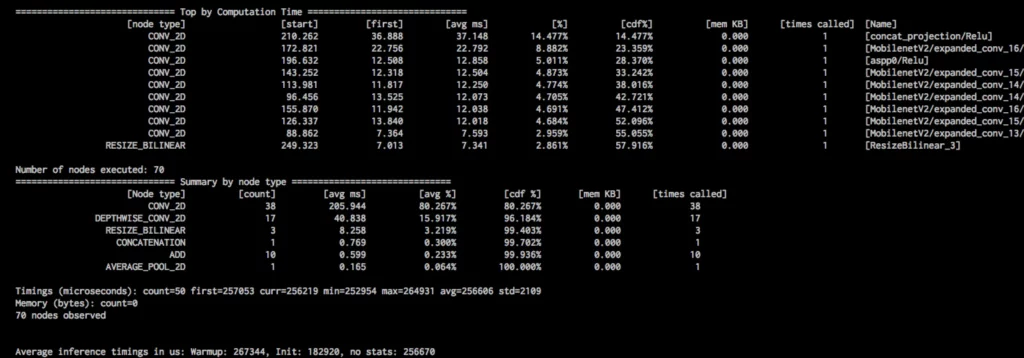
This above command should give you detailed profiling information from the operator, as shown in the image below. It’s a bit difficult to see, but if you look close, you’ll notice it has layer-by-layer memory consumption and inference times.
If you want to have consistent results in terms of profiling, then you can run on a single CPU and set CPU affinity, which can be done with the following command
The below image shows a more consistent result for a single core, even if you try the same experiment multiple times:
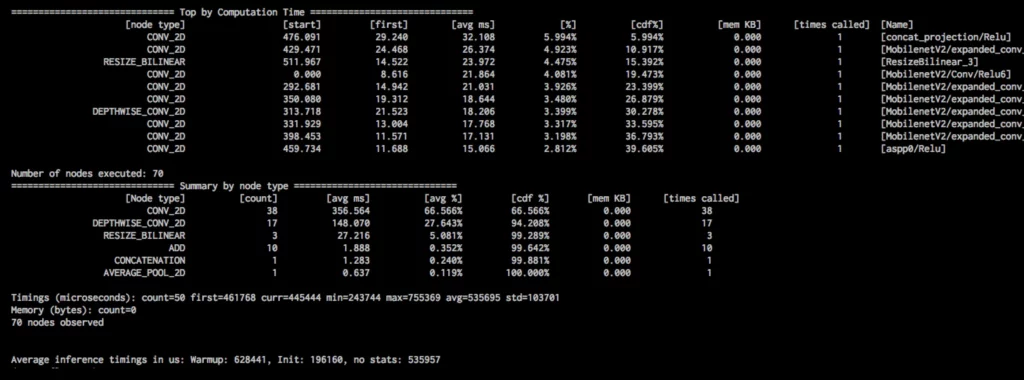
Once you have this kind of granular info, you can make a decision about which model to use without much difficulty. The average inference timing metric in the above image can be seen as the model’s inference runtime on the phone (I used a Pixel 2, for reference).
In the above experiments, I used the DeepLabV3 model to get the metrics. This would be more useful when comparing your own models, as opposed to the standard open source models. You can tweak the network based on operator performance. For example, depthwise separable convolutions seem to be faster than the regular convolution operator.
Most of the commands we covered in this tutorial are available in the TensorFlow documentation. Essentially, I just picked, clubbed, and experimented before posting it as a story.

Comments 0 Responses