
This post is a part of a series about feature engineering techniques for machine learning with Python.
Hey again! In this post, we’re going to explore feature scaling transformations for feature engineering.
Let’s start with feature magnitude. Frequently, our dataset contains features that highly vary in scales, and that’s a problem for some algorithms that rely on distance.
Table of contents:
Feature Scaling
Feature scaling refers to the methods used to normalize the range of values of independent variables. In other words, the ways to set the feature value range within a similar scale.
Why Feature Scaling Matters
Feature magnitude matters for several reasons:
- The scale of the variable directly influences the regression coefficient.
- Variables with a more significant magnitude dominate over the ones with a smaller magnitude range.
- Gradient descent converges faster when features are on similar scales.
- Feature scaling helps decrease the time to find support vectors for SVMs.
- Euclidean distances are sensitive to feature magnitude.

To overcome this effect, all features have to be at the same level of scale or magnitude, especially if the used models are sensitive to the magnitude. Below, we’ll cover a few common algorithm architectures, comparing their sensitivity to feature magnitude.
Algorithms sensitive to feature magnitude
- Linear and logistic regression
- Neural networks
- Support vector machines
- KNN
- K-means clustering
- Linear discriminant analysis (LDA)
- Principal component analysis (PCA)
Algorithms intensive to feature magnitude
- Classification and regression trees
- Random forests
- Gradient boosted trees
Scaling methods
Next, let’s take a closer look at the following feature scaling methods:
- Mean normalization
- Standardization
- Robust scaling (scaling to median and IQR)
- Scale to maximum and minimum
- Scale to the absolute maximum
- Scale to unit norm
Mean Normalization
Mean normalization suggests centering the variable at 0 and re-scaling the variable’s value range to the range of -1 to 1.
The method includes subtracting the mean from each variable observation and then dividing by the difference between the minimum and the maximum value of that variable:

Here’s an illustration of this method:
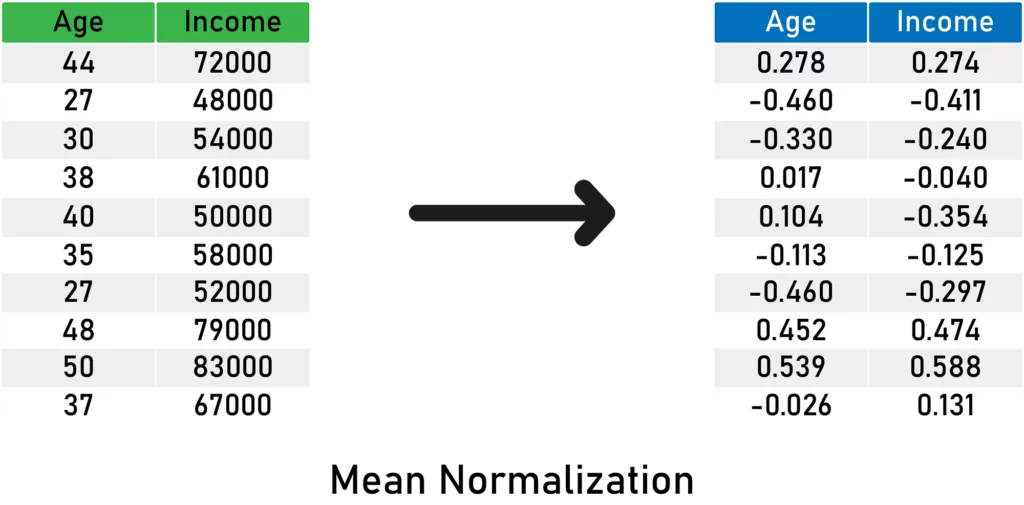
Here’s what you need to remember about mean normalization:
- It centers the mean at 0.
- The resulting variance will be different.
- It may modify the shape of the original distribution.
- It “normalizes” the minimum and maximum values within the range[-1, 1].
- It preserves outliers if they exist.
Here’s a code snippet with Pandas:
# import the needed packages
import pandas as pd
import numpy as np

# read your data
data = pd.read_csv("yourData.csv")

# calculate the means
means = train.mean(axis = 0)

# calculate max - min
max_min = train.max(axis = 0) - train.min(axis = 0)

# apply the transformation to data
train_scaled = (train - means) / max_min
test_scaled = (test - means) / max_minStandardization
Standardization suggests centering the variable at 0 and standardizing the variance to 1. The procedure includes subtracting the mean from each variable observation and then dividing by the standard deviation:

Here’s an example on some sample data:
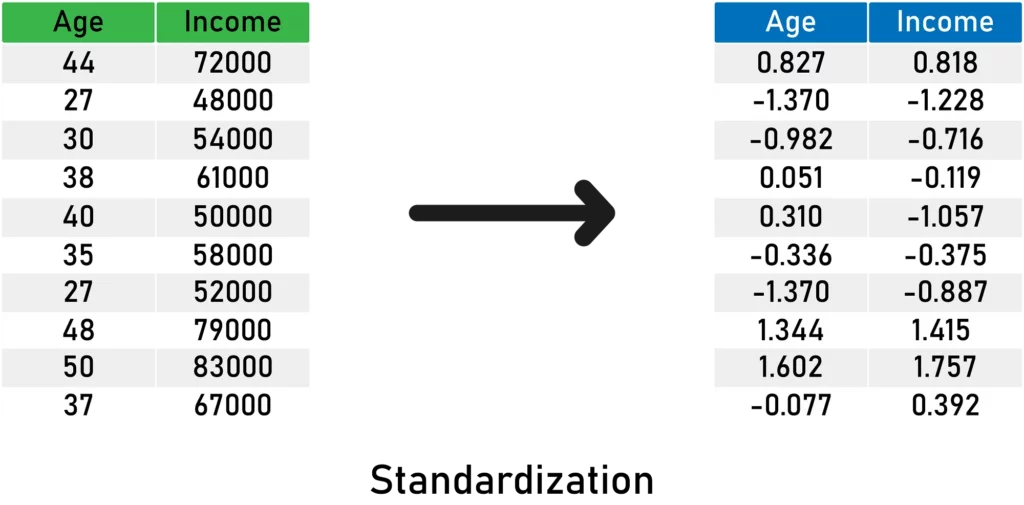
Here’s what you need to remember about standardization:
- It scales the variance at 1.
- It centers the mean at 0.
- It preserves the shape of the original distribution.
- It preserves outliers if they exist.
- Minimum and maximum values vary.
And here’s a code snippet with theStandardScaler object from sklearn:
# import the needed packages
import pandas as pd
from sklearn.preprocessing import StandardScaler

# read your data
data = pd.read_csv("yourData.csv")

# create the scaler object
scaler = StandardScaler()

# fit the scaler to the train data
scaler.fit(train)

# transform train and test data
train_scaled = scaler.transform(train)
test_scaled = scaler.transform(test)Robust Scaling (scaling to median and IQR)
In this method, the median is used instead of the mean. We remove the median from the variable observations, and then we scale to the inter-quantile range (IQR).

Here’s an illustration of robust scaling:
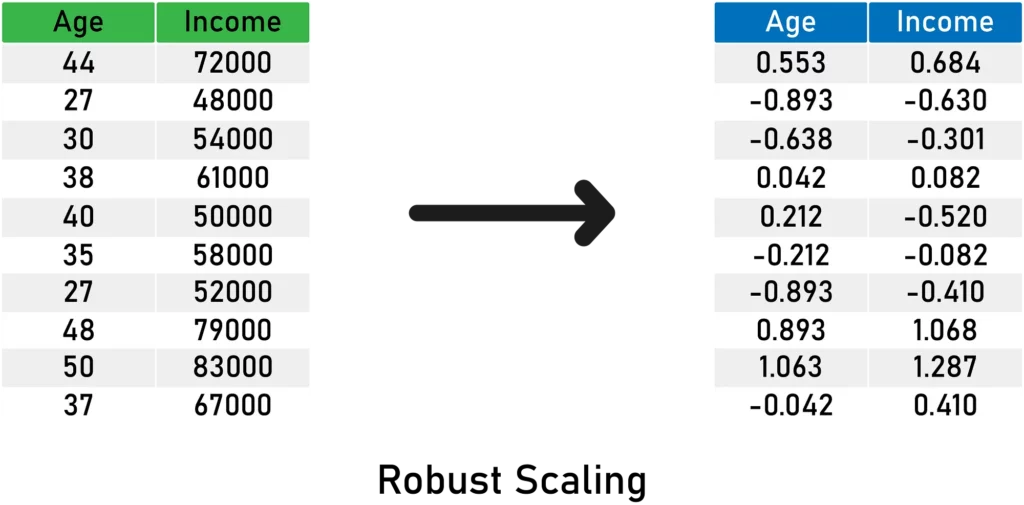
Here’s what you need to remember about robust scaling:
- It centers the median at 0 .
- The resulted variance varies across variables.
- It may not preserve the shape of the original distribution.
- The minimum and maximum values vary.
- It is robust to outliers.
And a code snippet with the RobustScaler from sklearn:
# import the needed packages
import pandas as pd
from sklearn.preprocessing import RobustScaler

# read your data
data = pd.read_csv("yourData.csv")

# create the scaler object
robust = RobustScaler()

# fit the scaler to the train data
robust.fit(train)

# transform train and test data
train_scaled = robust.transform(train)
test_scaled = robust.transform(test)Min-Max Scaling
Minimum and maximum scaling both compress the values between 0 and 1. It subtracts the minimum value from all the variable observations, and then divides it by the variable’s value range:

Here is an example using MinMax Scaling:
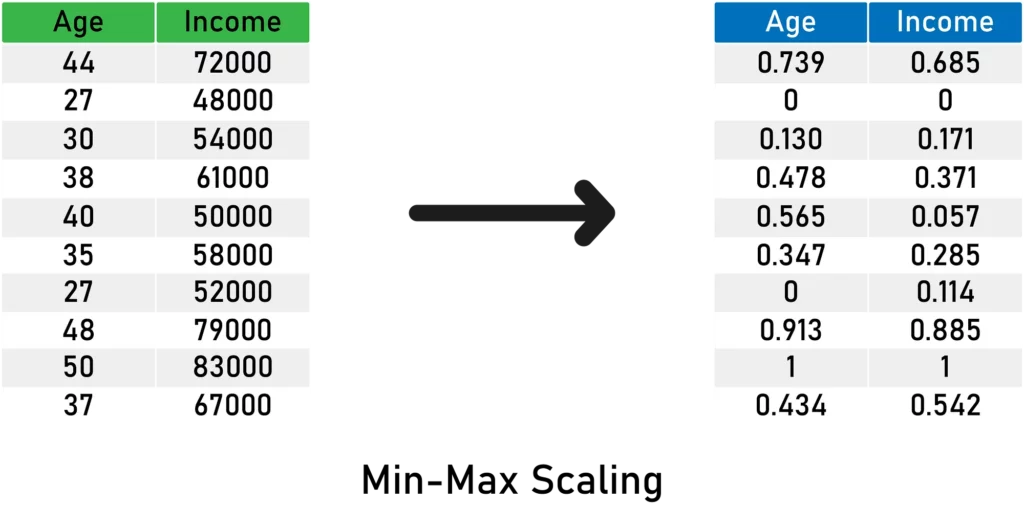
Here’s what you need to remember about Min-Max Scaling:
- It does not center the mean at 0.
- It makes the variance vary across variables.
- It may not maintain the shape of the original distribution.
- The minimum and maximum values are in the range of [0,1].
- This method is very sensitive to outliers.
And a code snippet with MinMaxScaler from sklearn:
# import the needed packages
import pandas as pd
from sklearn.preprocessing import MinMaxScaler

# read your data
data = pd.read_csv("yourData.csv")

# create the scaler object
min_max = MinMaxScaler()

# fit the scaler to the train data
min_max.fit(train)

# transform train and test data
train_scaled = min_max.transform(train)
test_scaled = min_max.transform(test)Maximum Absolute Scaling
Maximum absolute scaling scales the variable values between -1 and 1 by dividing the data by its maximum value:

Here’s an illustration of the concept:
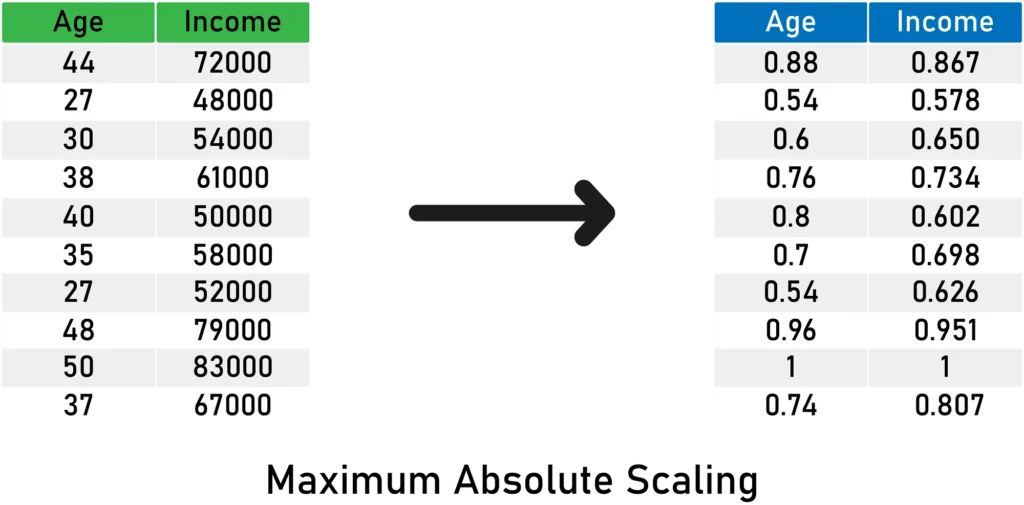
Here is what you need to remember about Maximum Absolute Scaling:
- The resulting mean is not centered.
- It doesn’t scale the variance.
- It’s sensitive to outliers.
Here’s a code snippet with the MaxAbsScaler from sklearn:
# import the needed packages
import pandas as pd
from sklearn.preprocessing import MaxAbsScaler

# read your data
data = pd.read_csv("yourData.csv")

# create the scaler object
max_abs = MaxAbsScaler()

# fit the scaler to the train data
max_abs.fit(train)

# transform train and test data
train_scaled = max_abs.transform(train)
test_scaled = max_abs.transform(test)Scaling to vector unit norm
In scale to the vector unit norm, we divide each feature’s vector by the distance of the vector, as shown below:

For the distance measure, you can use either:
- The Euclidean distance ( — or L2 norm) with the formula:

- The Manhattan distance ( — or L1 norm) with the formula:

Here is an example with L1 Norm:
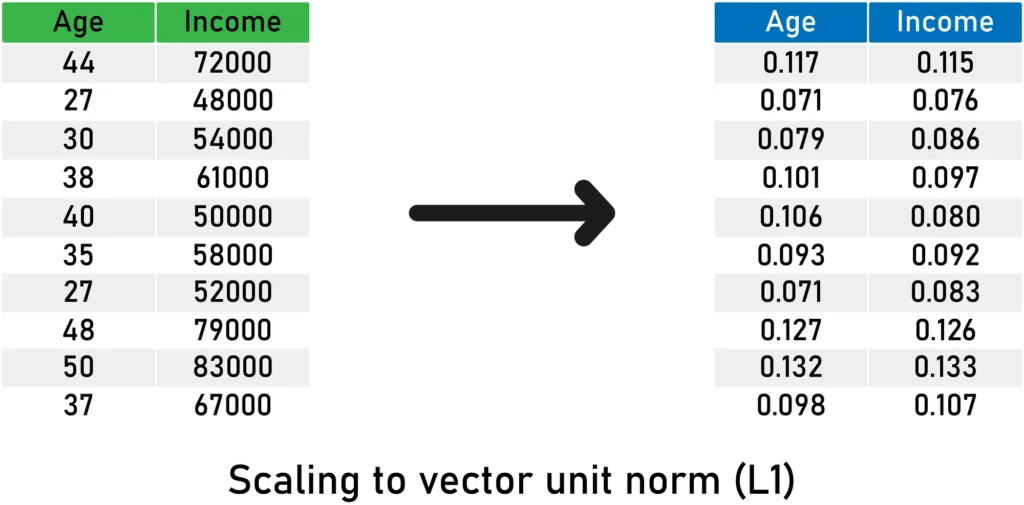
Here’s what you need to remember about scaling to the vector unit norm:
- The length of the resulting vector is 1.
- It normalizes the feature vector and not the observation vector.
- It’s sensitive to outliers.
- Recommended for text classification and clustering.
Here’s a code snippet using the Normalizer object from sklearn:
# import the needed packages
import pandas as pd
from sklearn.preprocessing import Normalizer

# read your data
data = pd.read_csv("yourData.csv")

# create the scaler object with your prefered norm.
max_abs = Normalizer(norm = 'l2')

# fit the scaler to the train data
max_abs.fit(train)

# transform train and test data
train_scaled = max_abs.transform(train)
test_scaled = max_abs.transform(test)Conclusion
You have to remember that the choice of the algorithm for your project impacts whether you need scale your variables or not. Once you make this determination, you then have a range of methods and techniques in your toolkits and to scale the data. Hopefully this guide is a helpful in selecting the correct methods.

Comments 0 Responses