
In a recent blog post, Facebook announced React Native version 0.62, and one of the top features of this release was a default integration of Flipper.
Flipper is an open source mobile debugging platform backed by Facebook. It is widely used by Android & iOS developers. Flipper’s simple and intuitive interface helps developers to visualise, inspect & control apps. It aims to be the number one companion for mobile app development.
Bringing Flipper to React Native—IMHO—is the beginning of new developer experience for React Native apps.
Features
Flipper enables RN developers to look deep inside their apps. Features like inspecting the native layout, monitoring the redux state, and testing deep linking will definitely boost development speed. Let’s dive into some awesome features Flipper is offering for RN apps.
React DevTool & Live Editing
React.js is well-known and well-regarded for its developer experience. It’s not just about React’s APIs—Facebook has also done a good job investing in React’s DevTool. Leveraging the React DevTool gives developers a complete picture of their component trees and helps in understanding an app’s behavior.
With Flipper, React DevTool is available to use by default and allows developers to update a component’s styles on the fly without any refresh. Here is a short demo:
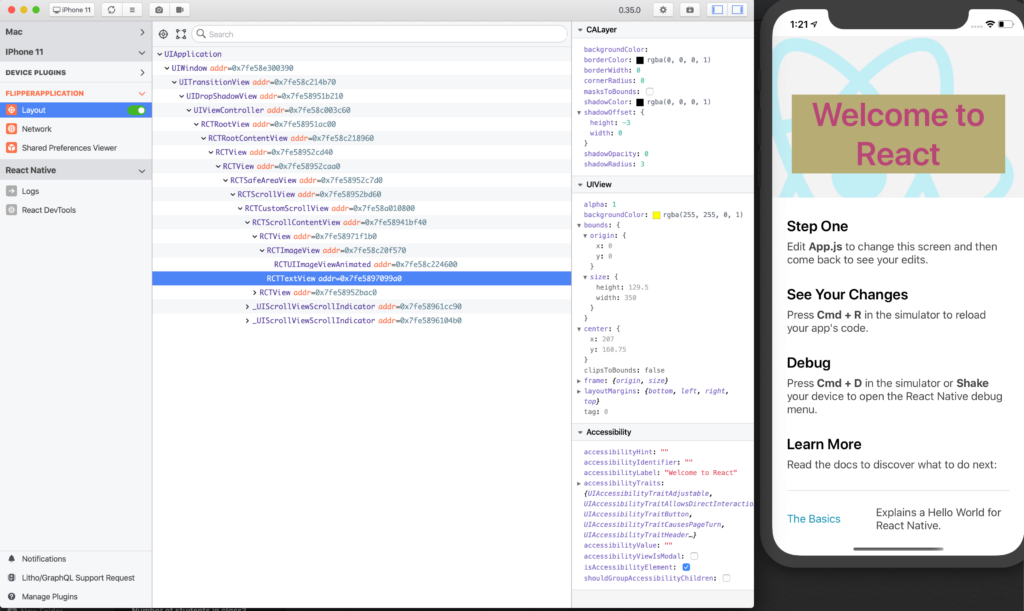
Native Layout Inspect
React Native transforms all components written in JS to the relevant native UI elements, depending on the target platform. This is the secret sauce behind the native feel of RN apps.
Without Flipper, inspecting the native layout of a RN app required a good deal of effort on both Android & iOS. For Android, Android Studio has its layout inspector that shows all UI elements. For iOS, Xcode’s has a Debug View Hierarchy option. Native UI elements and their associated properties are now easily accessible via Flipper’s layout inspect for both platforms in one window. Here’s what this looks like:
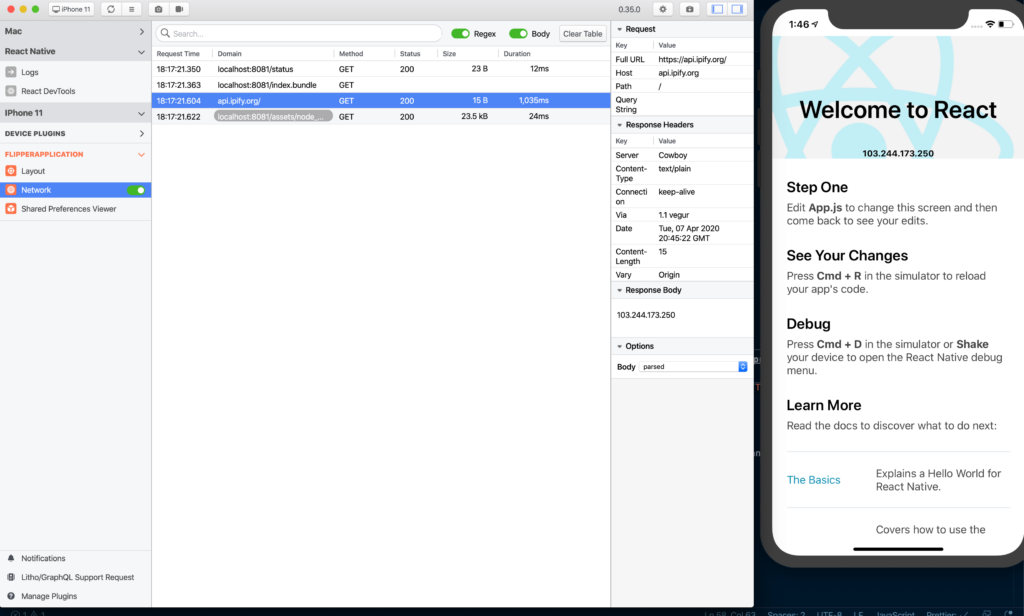
Network Inspect
Besides being able to inspect UI app layers in detail, Flipper has an interface to inspect all of the network requests made by your API. Though this feature was available with the previous RN Debugger, having it in one place will further speed up development. Here’s how the Rest API call looks in this inspector:
Metro & Simulator Actions
The most frequently used keys as a React Native developer are CMD + R—i.e reloading a JavaScript bundle. Flipper gives shortcuts for most commonly used metro actions—Reload JS & Open Dev Menu.
Beside metro actions, Flipper also offers shortcuts for simulator actions. We can take new screenshots and record our screens as we develop our apps.
Shared Preferences
Shared preferences allow us to handle an app’s preferences from Flipper without navigating around other menus and/or code. These preferences include features like enabling debug bundling and minification.
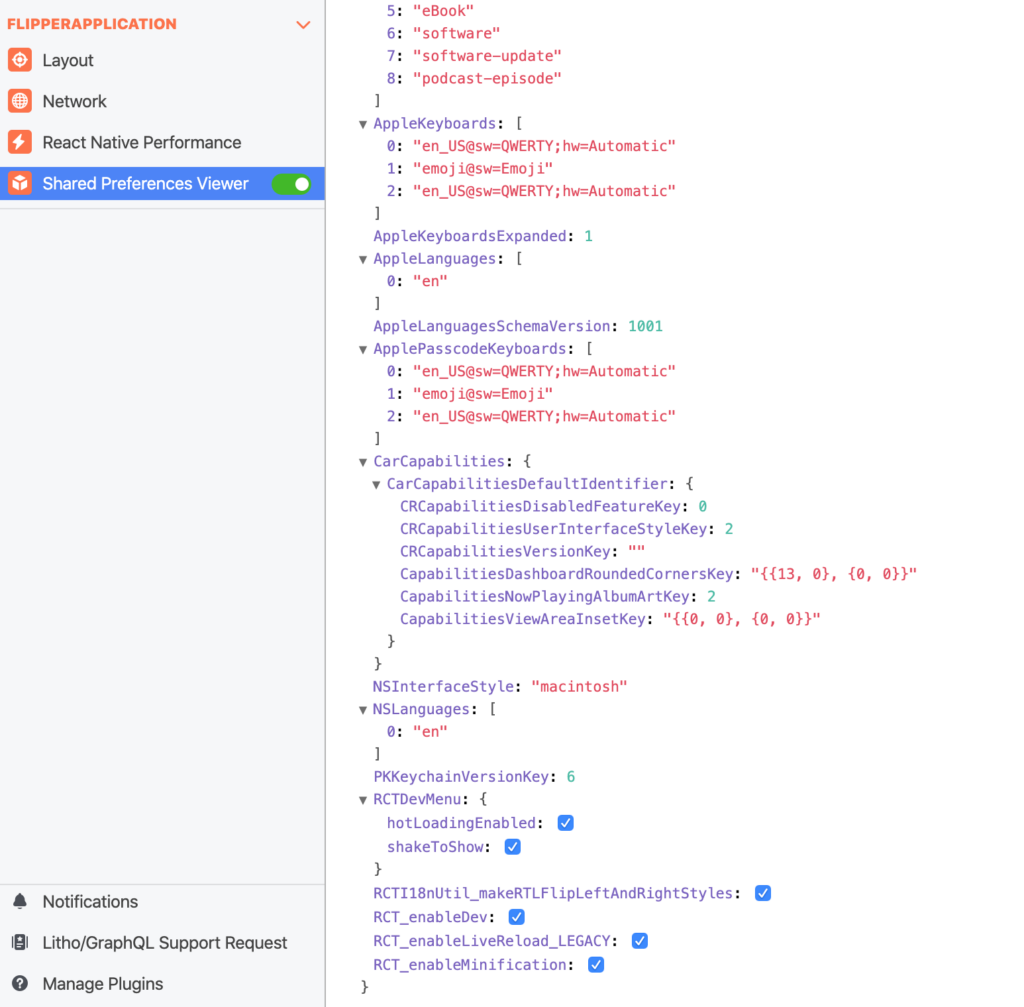
Image Inspect — Android Only
Just like with network inspect, we can monitor the fetch and cache of all the images rendered in our apps. An image cache can also be removed from Flipper.
Images also have useful attributes that allow us to monitor from where they are loaded and how long it took. Currently this plugin uses a Fresco backend and is only available for Android.
Crash Reporter
Monitoring app crashes was one of the most tedious tasks for RN developers prior to Flipper. With Flipper’s Crash Reporter, we can easily check the stack trace of a crash occurring on devices.
Deep Linking — Android Only
Another pain point for app developers is figuring out how to simulate launching an app with deep links. This is currently done via CLI commands for Android & iOS, and in certain cases it’s a sophisticated process to monitor logs for such app launches. Flipper allows developers to launch apps with defined deep linking, which can help speed up development cycles.
Plugins
One of the most important advantages of Flipper is its ability to extend. It includes an option for developers to write their own plugins to support their workflows. Moving forward, this will make Flipper one of the best debugging tools available. We’ll soon see a lot of great plugins coming from the community to further enhance how React Native apps are debugged.
I’ve cherry-picked a few useful plugins that are already available today, just to give you a taste.
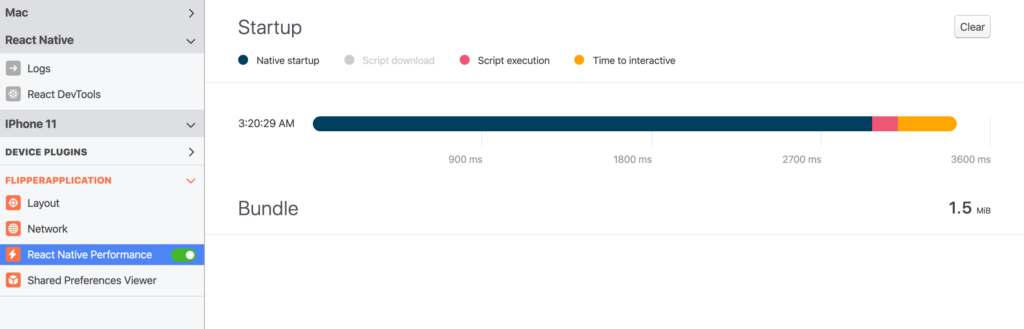
React Native Performance [Link]
One of the fey factors for an app’s success is its startup time. Though RN has a way to monitor the startup of our apps, it requires a not insubstantial amount of coding. This plugin makes it way easier. A life saver for benchmarking different optimizations.
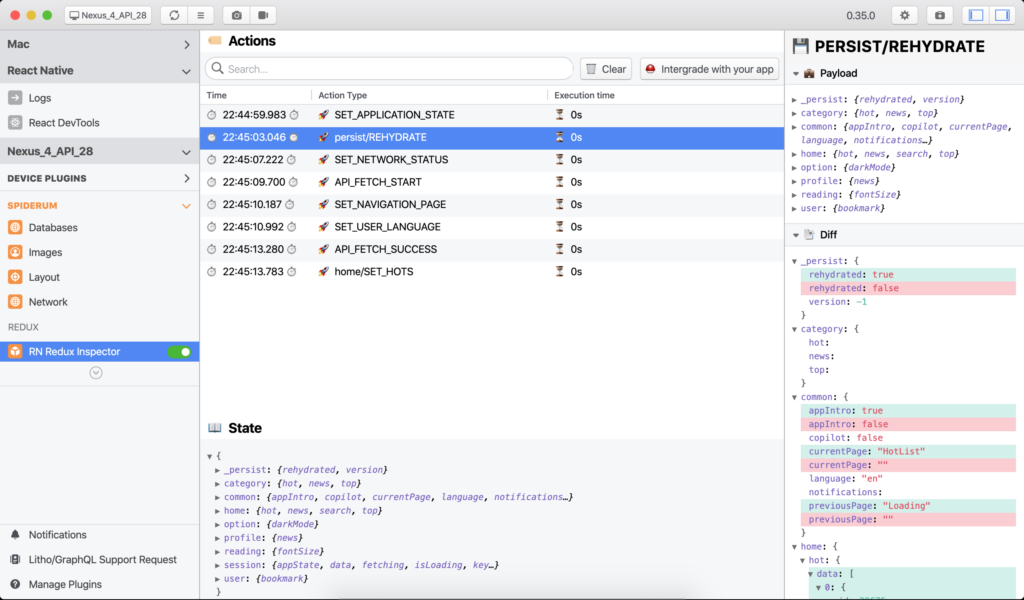
Redux Inspector [Link]
Redux as a state management tool has been a backbone of React apps for a long time now, and the Redux DevTool is one of the most integral parts of the development process. This plugin will make Flipper a one-window solution for managing Redux store, UI elements, network requests, and many other aspects of our apps.
Relay DevTools [Link]
Similar to React, Facebook has invested in the developer experience of Relay, as well. Relay DevTool is derived from React DevTool and eases the debugging of Relay-based applications. Flipper’s plugin for the Relay DevTool is also now available.
What lies ahead?
A consistent pain points for RN developers has long been the default debugging tool framework. Flipper looks to be a promising start for a new debugging experience for React Native developers. With the ability to integrate community-made plugins, it also has the potential to grow into one of the best debugging tools available.
Editor’s Note: Heartbeat is a contributor-driven online publication and community dedicated to providing premier educational resources for data science, machine learning, and deep learning practitioners. We’re committed to supporting and inspiring developers and engineers from all walks of life.
Editorially independent, Heartbeat is sponsored and published by Comet, an MLOps platform that enables data scientists & ML teams to track, compare, explain, & optimize their experiments. We pay our contributors, and we don’t sell ads.
If you’d like to contribute, head on over to our call for contributors. You can also sign up to receive our weekly newsletters (Deep Learning Weekly and the Comet Newsletter), join us on Slack, and follow Comet on Twitter and LinkedIn for resources, events, and much more that will help you build better ML models, faster.

Comments 0 Responses